
Fuel Economy Ratings Explained: What MPG Actually Means in the Real World

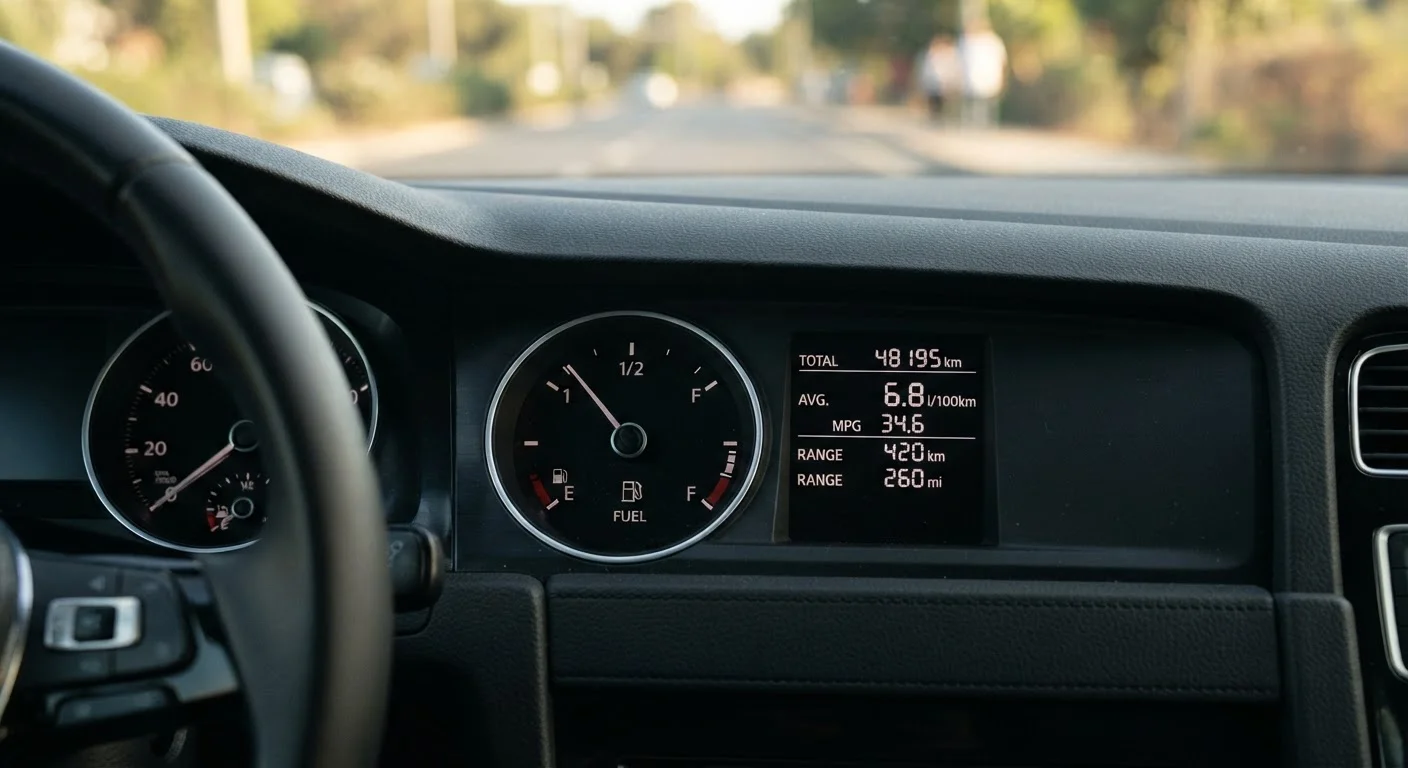
Photo: InsightsVault.com | Interesting Daily Reads editorial
Key Takeaways
- Official EPA MPG figures are laboratory estimates - real-world mileage is typically 10-20% lower.
- City and highway ratings reflect very different driving conditions; neither alone predicts your actual fuel costs.
- Vehicle speed, climate, load, and driving style all meaningfully affect real-world fuel economy.
- Tracking your own MPG at fill-up gives far more useful data than the sticker figure.
- Smarter driving habits can close much of the gap between rated and actual fuel economy.
How the EPA Measures Fuel Economy
Every new car sold in the U.S. carries an EPA fuel economy label - the familiar yellow-and-black Monroney sticker. Those numbers come from standardized chassis dynamometer tests conducted by manufacturers and verified by the EPA. Vehicles are run through simulated driving cycles in a climate-controlled lab, not on an actual road.
The EPA uses five test cycles to estimate real-world performance: city driving, highway driving, high speed, air conditioning use, and cold temperature starts. Results from all five are blended to produce the city, highway, and combined figures you see on the sticker. This methodology was overhauled in 2008 to better reflect real driving conditions after earlier tests consistently overstated fuel economy.
Despite those improvements, lab conditions can never fully replicate your commute. Fuel spending depends on more than pump prices - and the EPA rating is just one input in a more complicated equation.
The Gap Between Rated and Real-World MPG
Studies consistently show that drivers achieve less than the rated MPG under typical conditions. The gap is often 10-20% below the sticker, and it widens with certain driving patterns.
10-20%
Typical real-world MPG shortfall vs. EPA rating
U.S. Department of Energy data consistently shows most drivers fall below their vehicle's official fuel economy estimate under normal conditions.
Up to 25%
Fuel economy reduction from air conditioning use
According to the U.S. Department of Energy, A/C use can cut MPG by 5-25% depending on outside temperature and driving conditions.
~7-14%
MPG drop per 5 mph above 50 mph
The U.S. Department of Energy estimates this aerodynamic drag penalty applies for most conventional passenger vehicles at highway speeds.
Several factors drive this gap:
- Speed: Aerodynamic drag increases sharply above 50 mph, cutting efficiency on the highway.
- Temperature: Cold engines burn more fuel during warm-up, and winter-blend gasoline contains slightly less energy than summer-blend.
- Terrain: Hills and stop-and-go traffic increase fuel consumption in ways flat-road lab tests don't fully capture.
- Vehicle load: Passengers, cargo, and roof racks all add weight and drag.
- Accessory use: Air conditioning can reduce fuel economy by 5-25% depending on conditions, according to the U.S. Department of Energy.
Everyday driving habits like hard acceleration and late braking also quietly erode what your car is capable of achieving.
How to Use MPG Figures Realistically
The EPA rating is most useful as a comparison tool when shopping for a vehicle, not as a precise prediction of what you'll spend. When comparing two vehicles, a higher combined MPG almost always means lower long-term fuel costs - the relative ranking holds up even if the absolute numbers don't.
Calculate Your Own MPG - It Takes One Fill-Up
For your own vehicle, track actual fuel economy manually. Fill up completely, log the odometer, drive normally, fill up again, and divide miles driven by gallons used. Averaging several tanks gives a realistic baseline. Many modern vehicles display a running MPG estimate on the instrument cluster, but these can be optimistic - hand-calculated figures tend to be more reliable.
Once you know your real-world MPG, you can estimate annual fuel costs: divide your annual mileage by your actual MPG, then multiply by the current average fuel price in your area. This gives a far more grounded budget figure than any sticker will provide. For evidence-backed ways to close the gap, see practical techniques for better fuel efficiency.
This article provides general information about fuel economy ratings for educational purposes. Actual fuel costs depend on many variables specific to your vehicle, location, and driving conditions.
Frequently Asked Questions
The content provided on our blog site traverses numerous categories, offering readers valuable and practical information. Readers can use the editorial team’s research and data to gain more insights into their topics of interest. However, they are requested not to treat the articles as conclusive. The website team cannot be held responsible for differences in data or inaccuracies found across other platforms. Please also note that the site might also miss out on various schemes and offers available that the readers may find more beneficial than the ones we cover.