
Reading the True Cost of a Purchase

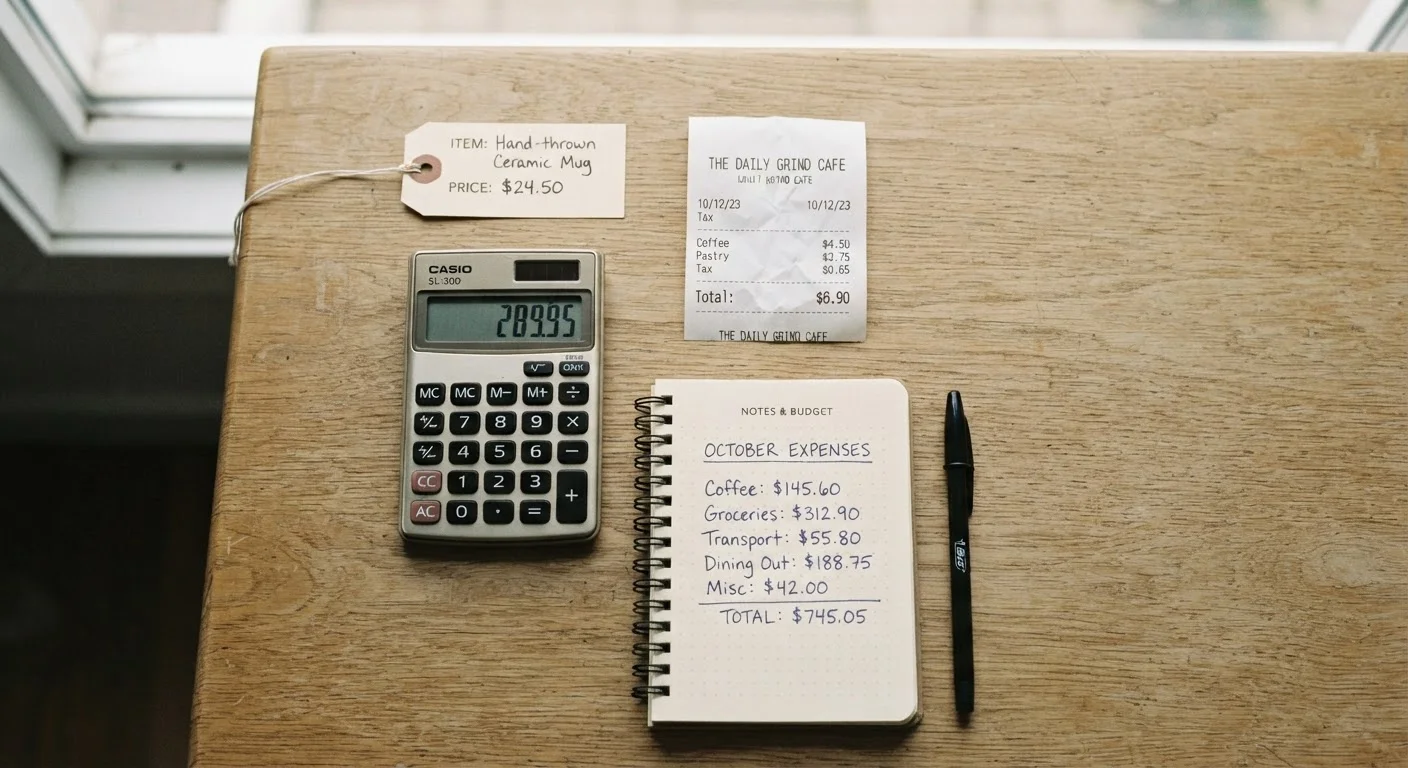
Photo: InsightsVault.com | Interesting Daily Reads editorial
Key Takeaways
- Sticker price rarely reflects what you'll actually spend over time.
- Running costs, lifespan, and financing charges are major components of true cost.
- Dividing total cost by expected lifespan gives a useful cost-per-year figure for comparison.
- Hidden fees - from shipping to warranty add-ons - can meaningfully shift the math.
- A higher upfront price sometimes results in a lower true cost than a cheaper alternative.
Why the Sticker Price Misleads You
Walk into any store and you'll see a number in big print: the sticker price. That number is designed to be the first thing you process, and for many shoppers, it becomes the decision-making anchor. The problem is that it represents only one moment in a product's financial relationship with you - the moment of purchase.
Everything that follows - energy bills, replacement parts, service fees, consumables - tends to arrive in small, irregular amounts that feel disconnected from the original buy. By the time you've spent twice the purchase price on upkeep, the sticker price is a distant memory. This is the gap that true cost analysis is designed to close.
Retailers aren't doing anything wrong by displaying a purchase price - it's the standard convention. But as a consumer, you're responsible for building the full picture before you commit. The good news: the framework for doing this is straightforward once you know the components to look for.
The Four Components of True Cost
Breaking true cost into four categories makes it manageable for any purchase, large or small.
1. Acquisition Cost
This is the sticker price plus anything paid at point of sale: taxes, delivery fees, installation charges, and any financing origination fees. If you're paying on credit, the interest paid over the loan term is part of this figure too.
2. Running Costs
These are the recurring expenses tied to owning and operating the item - fuel, electricity, ink cartridges, filters, subscriptions, or insurance premiums. For a vehicle, this category alone typically dwarfs the purchase price over time. See our full breakdown of annual car ownership costs for a detailed example of how running costs stack up.
3. Maintenance and Repairs
Most products require periodic upkeep. Some costs are predictable (annual servicing, filter replacements), while others are variable (unexpected repairs). Budget-friendly products with poor build quality often incur disproportionately high maintenance costs.
4. Replacement and Disposal Cost
When a product reaches the end of its useful life, you'll need to replace it - and sometimes pay to dispose of the old one. Dividing the total cost by expected lifespan gives you an annualized cost-per-year figure, which is the most honest basis for comparison between two products at different price points.
~$12,000
Average annual cost to own and operate a vehicle in the U.S.
According to AAA's annual 'Your Driving Costs' study, which includes fuel, maintenance, insurance, depreciation, and financing.
2-3×
Typical ratio of lifetime running costs to purchase price for appliances
Consumer energy and maintenance data suggest that for major home appliances, operating costs over a decade often exceed the original purchase price.
15-20%
Additional cost added by financing on a mid-range purchase
At common consumer loan rates, financing a purchase over 12-24 months typically adds 15-20% to the total amount paid, depending on the interest rate.
Spotting Hidden Fees Before You Buy
Hidden fees are costs that aren't prominently displayed at the point of decision. They're not always deceptive - some are disclosed in fine print - but they're easy to miss when you're focused on the headline price.
Common categories to check for include: mandatory accessories (a product that requires proprietary consumables), extended warranty upsells, restocking or return fees if the item doesn't work out, and subscription lock-ins that auto-renew. Online purchases add their own layer - the real cost differences between online and in-store shopping include shipping fees, dynamic pricing, and bundled charges that can quietly inflate what looked like a lower price. Similarly, surge fees and bundled shipping can flip the math on online deals even when the listed item price appears lower.
Use the Cost-Per-Year Method
Before finalizing any significant purchase, search for the product model plus terms like "common repairs," "running costs," or "annual maintenance" to get a realistic picture from current owners.
Applying True Cost Thinking to Real Decisions
The goal isn't to turn every shopping trip into an accounting exercise - it's to build a mental habit that flags high-risk purchases before you commit. For small, low-cost items, a quick mental estimate is enough. For purchases over a few hundred dollars, it's worth spending five minutes on actual numbers.
A useful comparison method: calculate the cost-per-year for each option you're considering. Add purchase price and estimated running costs, then divide by expected lifespan in years. This normalizes the comparison and often reveals that a higher-priced item is actually the lower-cost choice over time. When spending more upfront costs less over time explains the specific indicators that signal when a premium price pays off.
For broader strategies on reducing what you spend day-to-day, the Cutting Daily Costs hub offers actionable approaches that complement this kind of purchase analysis.
Frequently Asked Questions
The content provided on our blog site traverses numerous categories, offering readers valuable and practical information. Readers can use the editorial team’s research and data to gain more insights into their topics of interest. However, they are requested not to treat the articles as conclusive. The website team cannot be held responsible for differences in data or inaccuracies found across other platforms. Please also note that the site might also miss out on various schemes and offers available that the readers may find more beneficial than the ones we cover.