
Reading Your Utility Bill: The Numbers That Tell You Where Energy Is Being Wasted

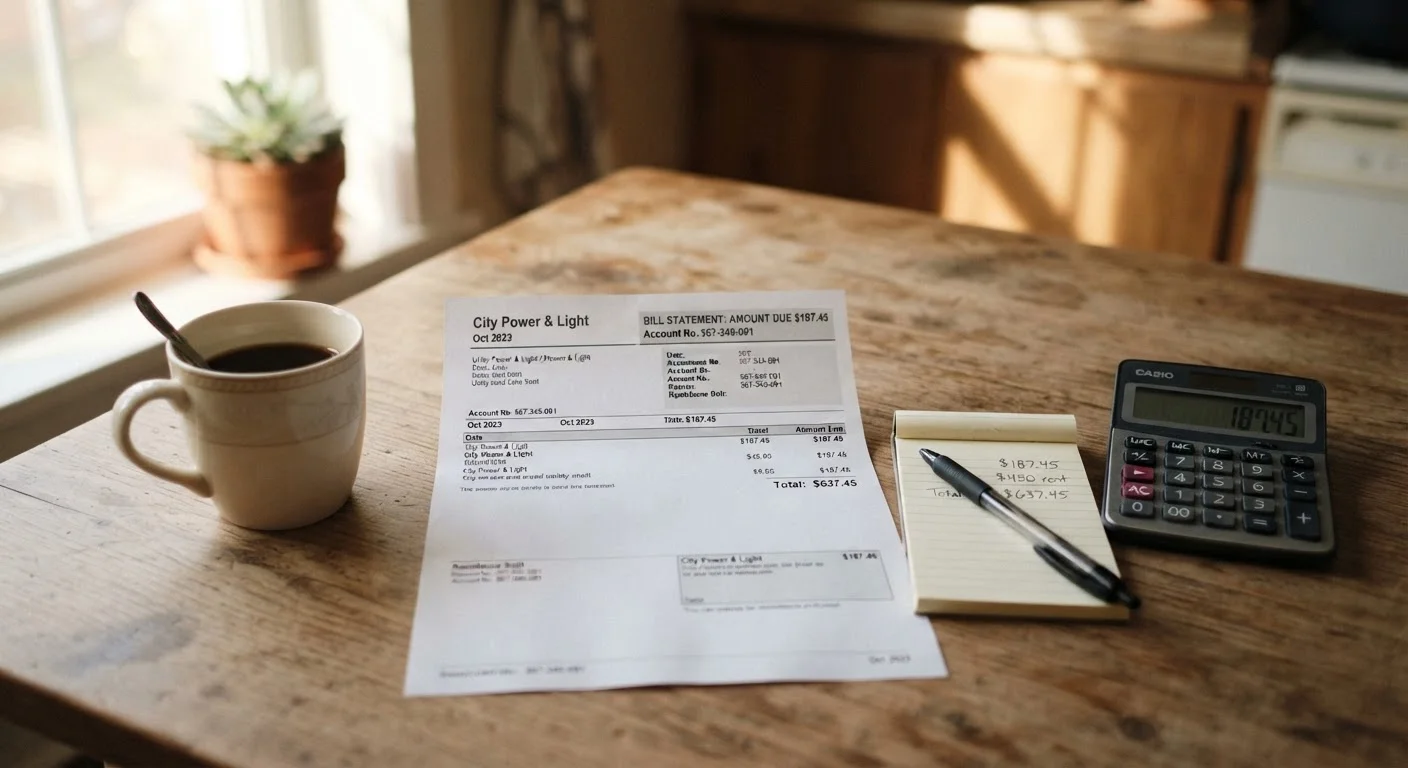
Photo: InsightsVault.com | Interesting Daily Reads editorial
What Your Bill Is Actually Showing You
Most homeowners glance at the total amount due and move on. That's understandable, but those middle pages contain the data points that actually tell you whether your home is running efficiently or burning money unnecessarily. If you're new to managing energy costs, the bill is the right place to start.
Every utility bill has a few key figures worth locating each month:
- kilowatt-hours (kWh) consumed - the actual volume of electricity used, independent of rate changes
- therms or CCF - the gas equivalent, measuring heat content delivered
- billing period dates - varying cycle lengths can make month-to-month comparisons misleading
- rate schedule or tariff code - indicates whether you're on a flat rate, tiered pricing, or a time-of-use plan
- demand charge (if present) - common on some residential accounts, this charges based on your peak usage window, not just total consumption
The kWh figure is the most diagnostic number on the bill. If your total due rises but your kWh stays flat, your utility raised its rate. If your kWh climbs and nothing obvious changed - same household size, same season - that's a signal worth investigating.
| Average U.S. household electricity use | ~10,500 kWh per year (U.S. Energy Information Administration (EIA)) |
| Average monthly residential electric bill | ~$137 (U.S. Energy Information Administration (EIA)) |
| Share of home energy used for heating & cooling | ~43% (U.S. Department of Energy) |
| Water heating share of home energy use | ~14-18% (U.S. Department of Energy) |
| Standby power (phantom load) share of electricity | ~5-10% (Lawrence Berkeley National Laboratory estimates) |
Month-Over-Month and Year-Over-Year Comparisons
A single month's bill tells you little. Patterns across months tell you a great deal. Most utilities print a 12- or 13-month usage bar chart on the bill itself - use it. Comparing the same month in consecutive years strips out seasonal noise and gives you a true baseline.
Look for these red flags in the data:
- Unexplained consumption jumps: A 15-20% increase in kWh during a mild month - not a heat wave or cold snap - can point to a failing appliance, a new phantom load, or a malfunctioning HVAC system. Standby power draw is a frequent culprit that goes unnoticed until you spot it in the numbers.
- Winter gas spikes beyond degree-day norms: Utilities often publish heating degree-day (HDD) data alongside usage. If your gas consumption rose faster than HDD climbed, your heating system may be losing efficiency. Common but overlooked causes include air leaks, dirty filters, and aging heat exchangers.
- Flat summer electric use that should be dropping: If you made efficiency improvements but summer kWh didn't budge, air conditioning is likely absorbing any gains you made elsewhere.
Water heating is another figure worth watching. It can represent roughly 14-18% of a home's total energy use, yet most households treat it as a fixed cost. It isn't. See what drives those costs and which adjustments move the needle.
kilowatt-hour (kWh)
The standard unit of electrical energy on your bill. One kWh equals 1,000 watts of power used for one hour - running a 100-watt bulb for 10 hours, for example.
Therm / CCF
Units used to measure natural gas consumption. A therm equals 100,000 BTUs of heat energy; CCF (hundred cubic feet) is a volume measure that utilities convert to therms using a heat factor.
Time-of-Use (TOU) Rate
A pricing structure where electricity costs more during peak demand hours (typically late afternoon and evening) and less during off-peak hours. Shifting high-draw tasks to off-peak windows can lower costs.
Demand Charge
A fee based on the highest rate of power draw recorded during the billing period - often a 15-minute peak - rather than total consumption. More common for commercial accounts but appears on some residential tariffs.
Heating Degree-Day (HDD)
A measure of how cold a day was relative to a 65°F baseline. Utilities use cumulative HDD to normalize gas consumption data, making it easier to compare usage across winters of different severity.
Base Charge / Customer Charge
A fixed monthly fee that appears regardless of how much energy you use. It covers meter reading, infrastructure maintenance, and grid access - it cannot be reduced by using less energy.
Turning Bill Data Into Action
Once you've identified where consumption is climbing, the next step is deciding which interventions offer the best return for your effort. A professional energy audit can pinpoint losses with diagnostic tools - blower door tests, thermal imaging - that no bill reading alone can reveal. But a lot of the low-hanging fruit is identifiable from the bill itself.
Use the kWh data to estimate appliance costs: multiply an appliance's wattage by hours of daily use, divide by 1,000 to get kWh, then multiply by your rate per kWh. That math quickly shows which devices are worth replacing or managing more carefully.
For practical changes you can make without spending much, affordable efficiency upgrades cover actions that take under an hour and cost little upfront. For a fuller picture across seasons and systems, the year-round energy savings roadmap ties all the pieces together.
The bill is not just a payment notice. It's a monthly performance report on your home. Reading it critically - kWh consumed, year-over-year trends, rate schedule - gives you the evidence base to act on, rather than guess at, where energy is being wasted. See also room-by-room efficiency practices and the habits that consistently reduce energy costs for targeted next steps.
The content provided on our blog site traverses numerous categories, offering readers valuable and practical information. Readers can use the editorial team’s research and data to gain more insights into their topics of interest. However, they are requested not to treat the articles as conclusive. The website team cannot be held responsible for differences in data or inaccuracies found across other platforms. Please also note that the site might also miss out on various schemes and offers available that the readers may find more beneficial than the ones we cover.